What is an Opportunity Solution Tree (OST) & Why Product Teams Need It
Opportunity Solution Trees (OSTs) are visual frameworks used by product teams to map the pathway from strategic business goals toward validated product solutions. Popularized by Teresa Torres, an OST ensures every initiative is anchored in proven customer needs and measured outcomes—moving teams beyond the risks of solution-first thinking and into a process of evidence-based product development [Product Talk].
How OSTs Differ from Solution-First Thinking
Many product teams jump directly to building features driven by stakeholder requests. This approach risks delivering work that doesn’t address real customer problems. OSTs instead replace “solution-first” with “outcome-first,” helping teams start from business objectives and drill down to genuine opportunities (user needs) before proposing solutions [Product Talk] [Product School].
OSTs:
- Resolve the balance between business goals and customer value
- Allow teams to visualize and share the logical connections between outcomes, opportunities, and solutions, building alignment and better decision-making
- Unlock continuous learning by supporting iterative experiments before committing to large launches, as advocated by Teresa Torres and recommended by SVPG
Key Elements: Outcomes, Opportunities, Solutions
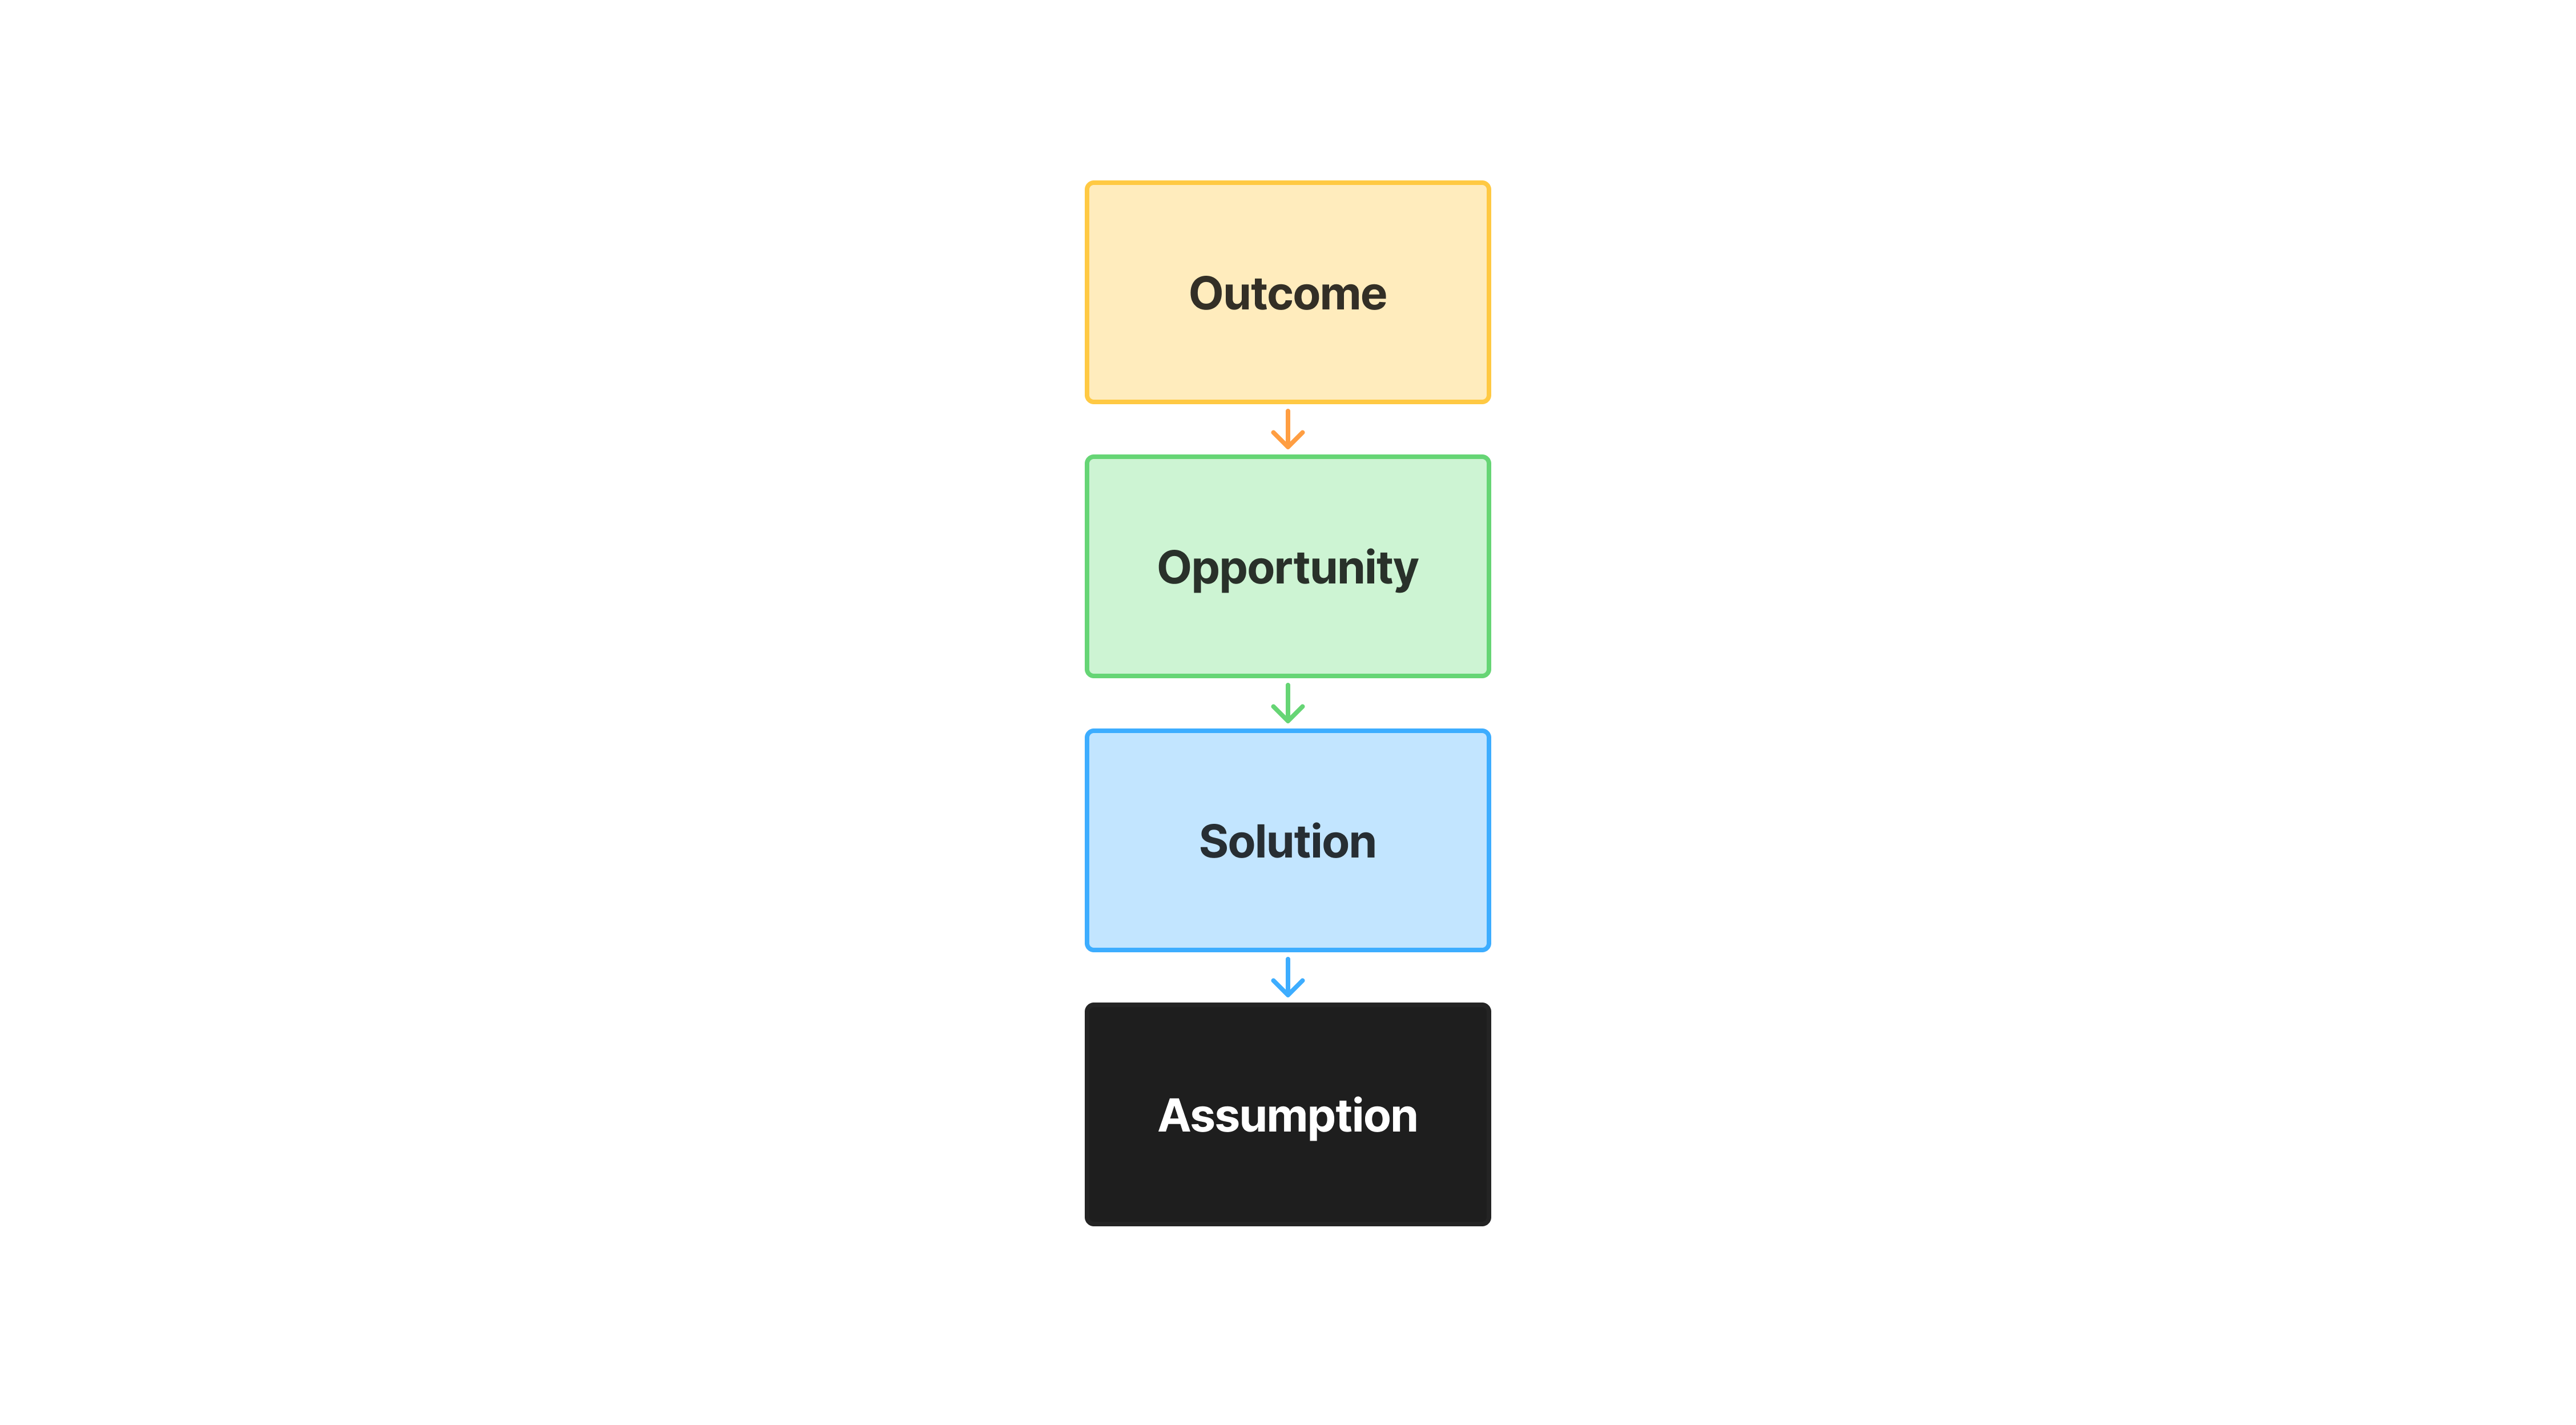
Every OST consists of four connected layers, each illuminating a different aspect of product discovery:
- Outcome: The top-level goal—what measurable result does your team want to achieve? (e.g., “Increase retention by 15%”) [Product Talk] [ProductPlan]
- Opportunities: Unmet user needs, pains, or jobs to be done. These are revealed through customer research and analysis—each opportunity represents a possible path toward the outcome [Product School].
- Solutions: Ideas, initiatives, or features for addressing each opportunity. These are not brainstormed in isolation; they are mapped directly to the opportunities they could address.
- Experiments: Tests and validation methods for each solution, ensuring teams collect data and feedback before scaling their ideas [Amplitude].
By visually mapping these components, teams make relationships clear and actionable while maintaining persistent focus on outcomes.
The Value of Mapping and Visualizing Discovery Over Time
OSTs provide measurable benefits:
- Foster transparency by externally visualizing strategy, priorities, and ongoing learning cycles for all stakeholders [Product Talk] [ProductPlan]
- Uncover gaps in research, strengths in proposed solutions, and areas for realignment—driving faster iteration and improved business outcomes
- Make complex relationships between product strategy, user needs, and team decisions actionable—essential for companies facing rapid change or product complexity (SVPG)
Visualization ensures everyone—from executives to engineers—can see how work ladders up to strategic goals, reducing misalignment and wasted effort.
Examples of OSTs for Product Teams
Example 1: Driving Feature Adoption
- Outcome: Increase new feature adoption by 30%
- Opportunity: Users aren’t noticing new features, lack sufficient onboarding.
- Solution: In-app announcement, guided tours.
- Assumption: An in-app annoucement paired with a guided tour will increase adoption of new features (A/B test)
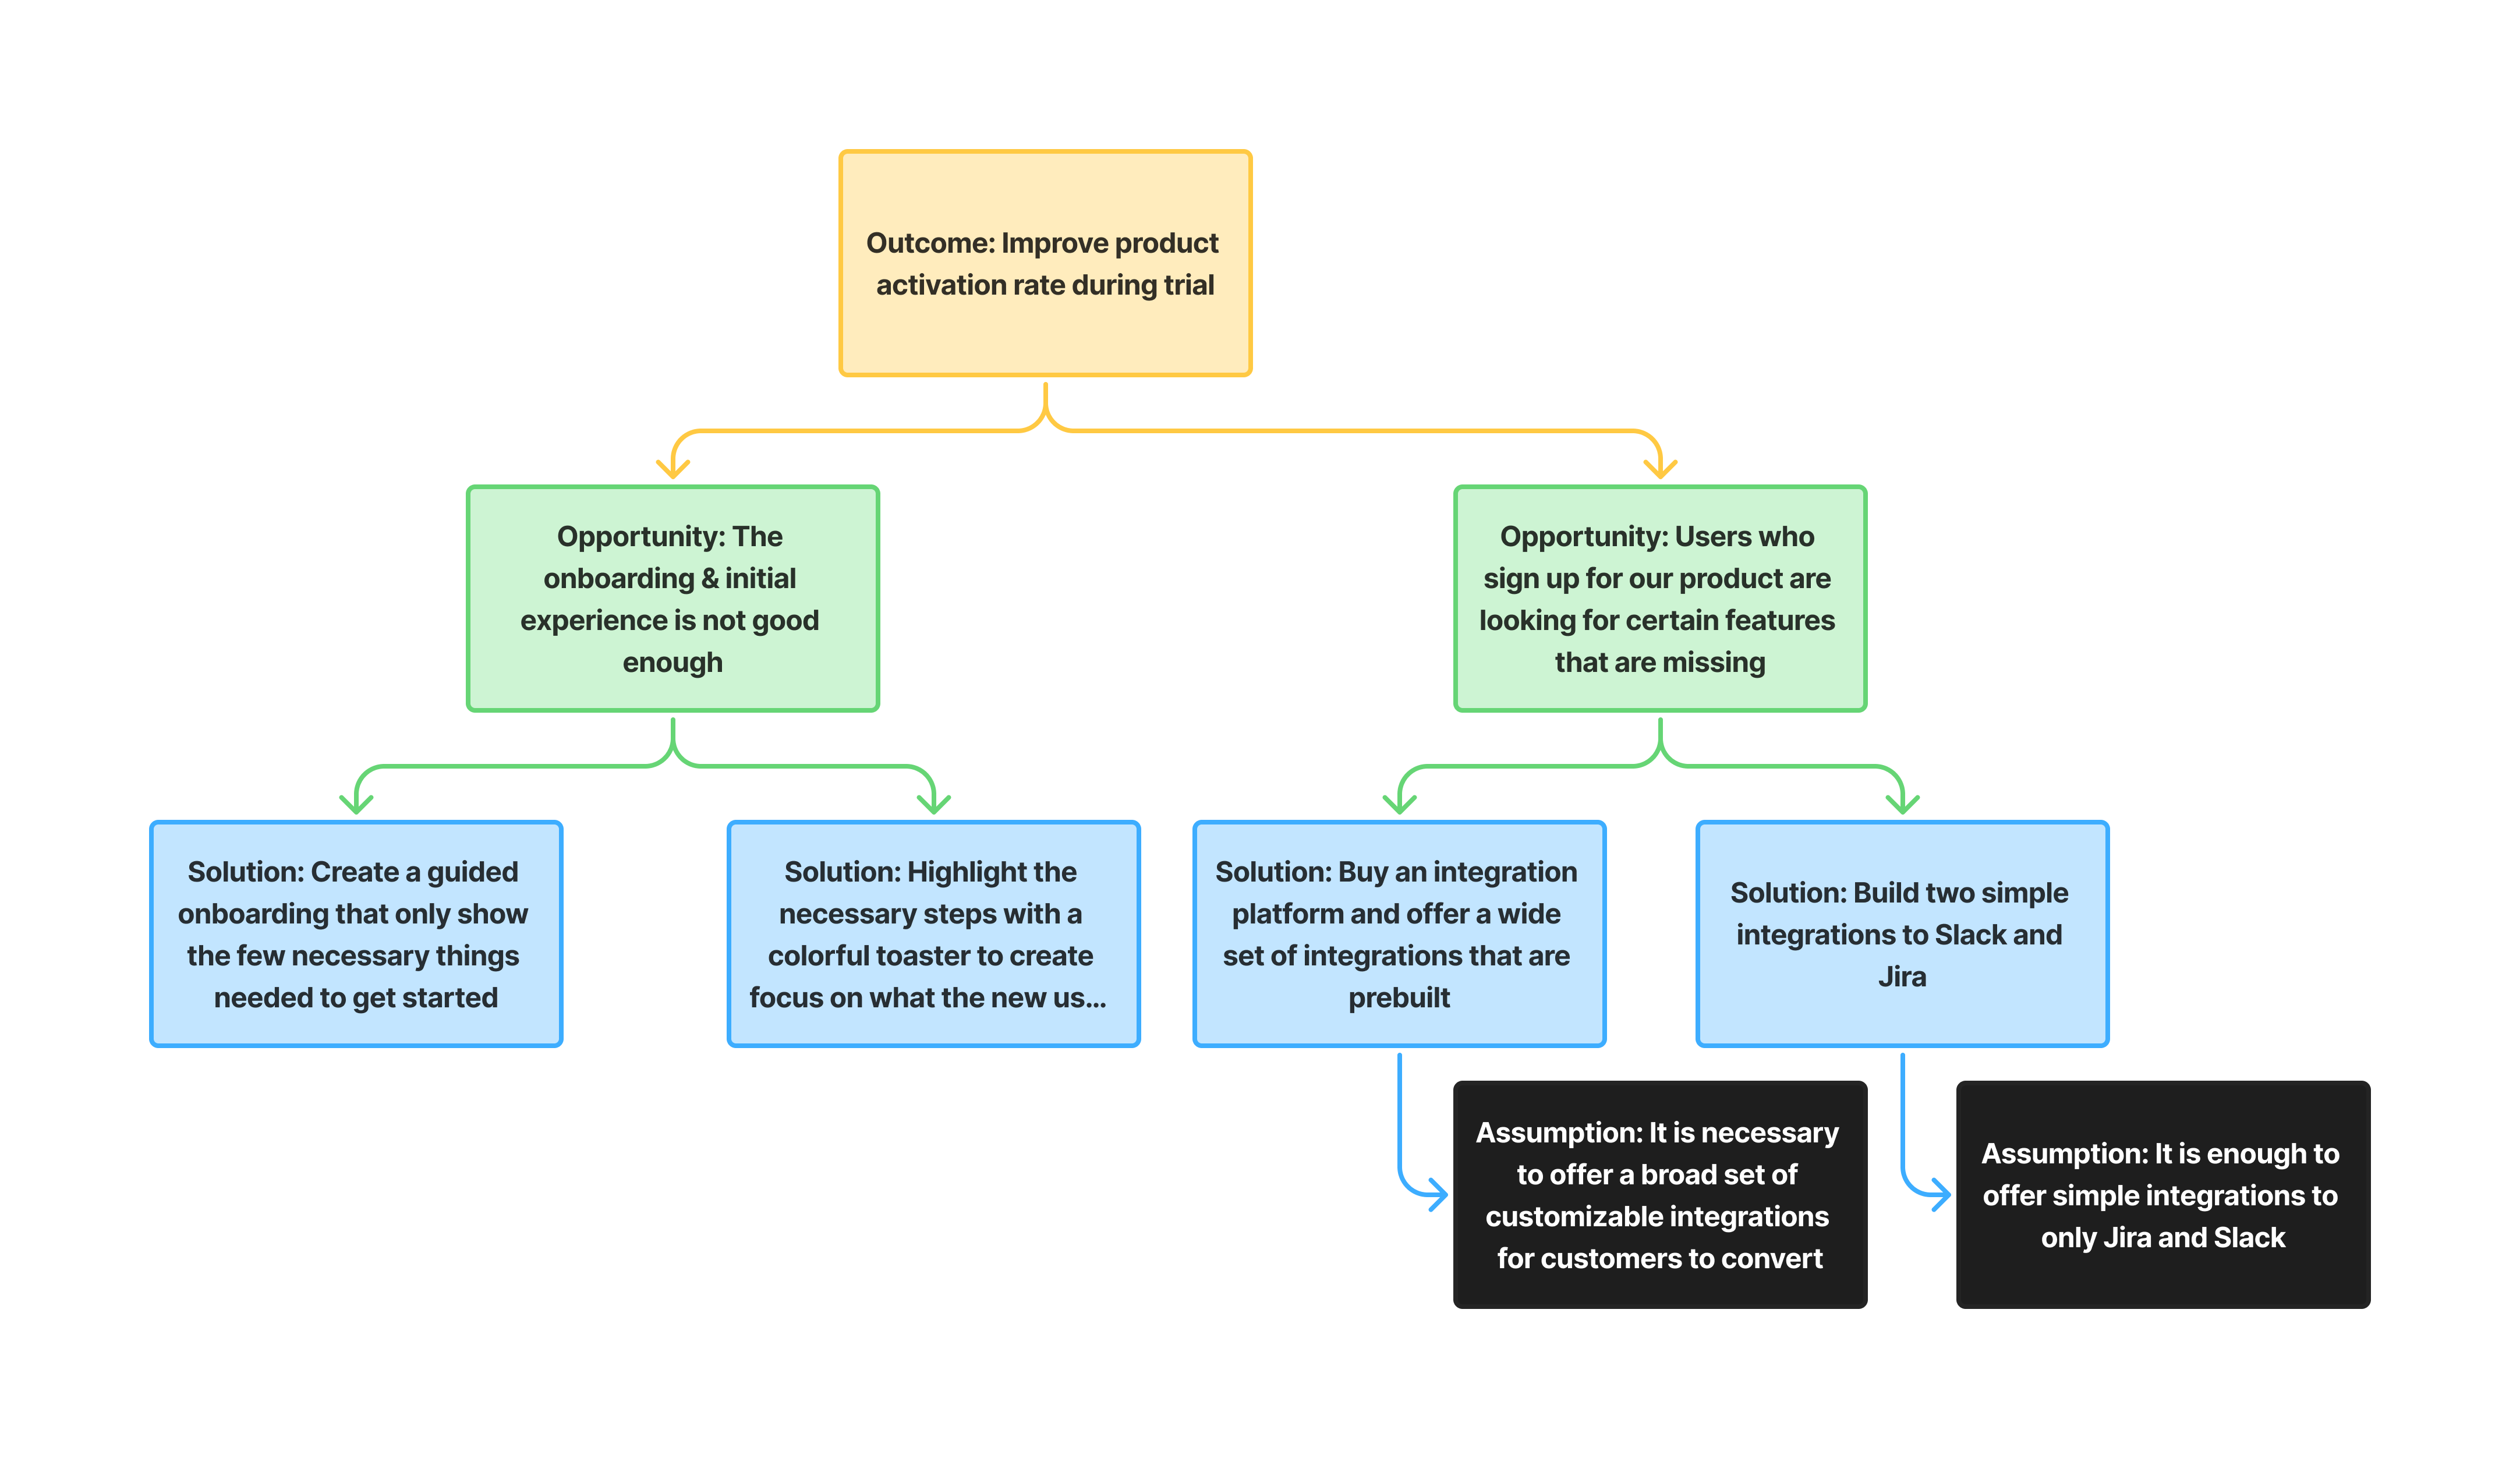
Example 2: Improve Product Activation
- Outcome: Improve product activation rate during trial from 35 % to 45 %.
- Opportunity: Users who sign up for our product are looking for certain features that are missing.
- Solution: Buy an integration platform and offer a wide set of integrations that are prebuilt.
- Assumption: It is necessary to offer a broad set of customizable integrations for customers to convert.
For more templates and scenarios, see ProductTalk.org, ProductPlan.com, and SVPG.com.
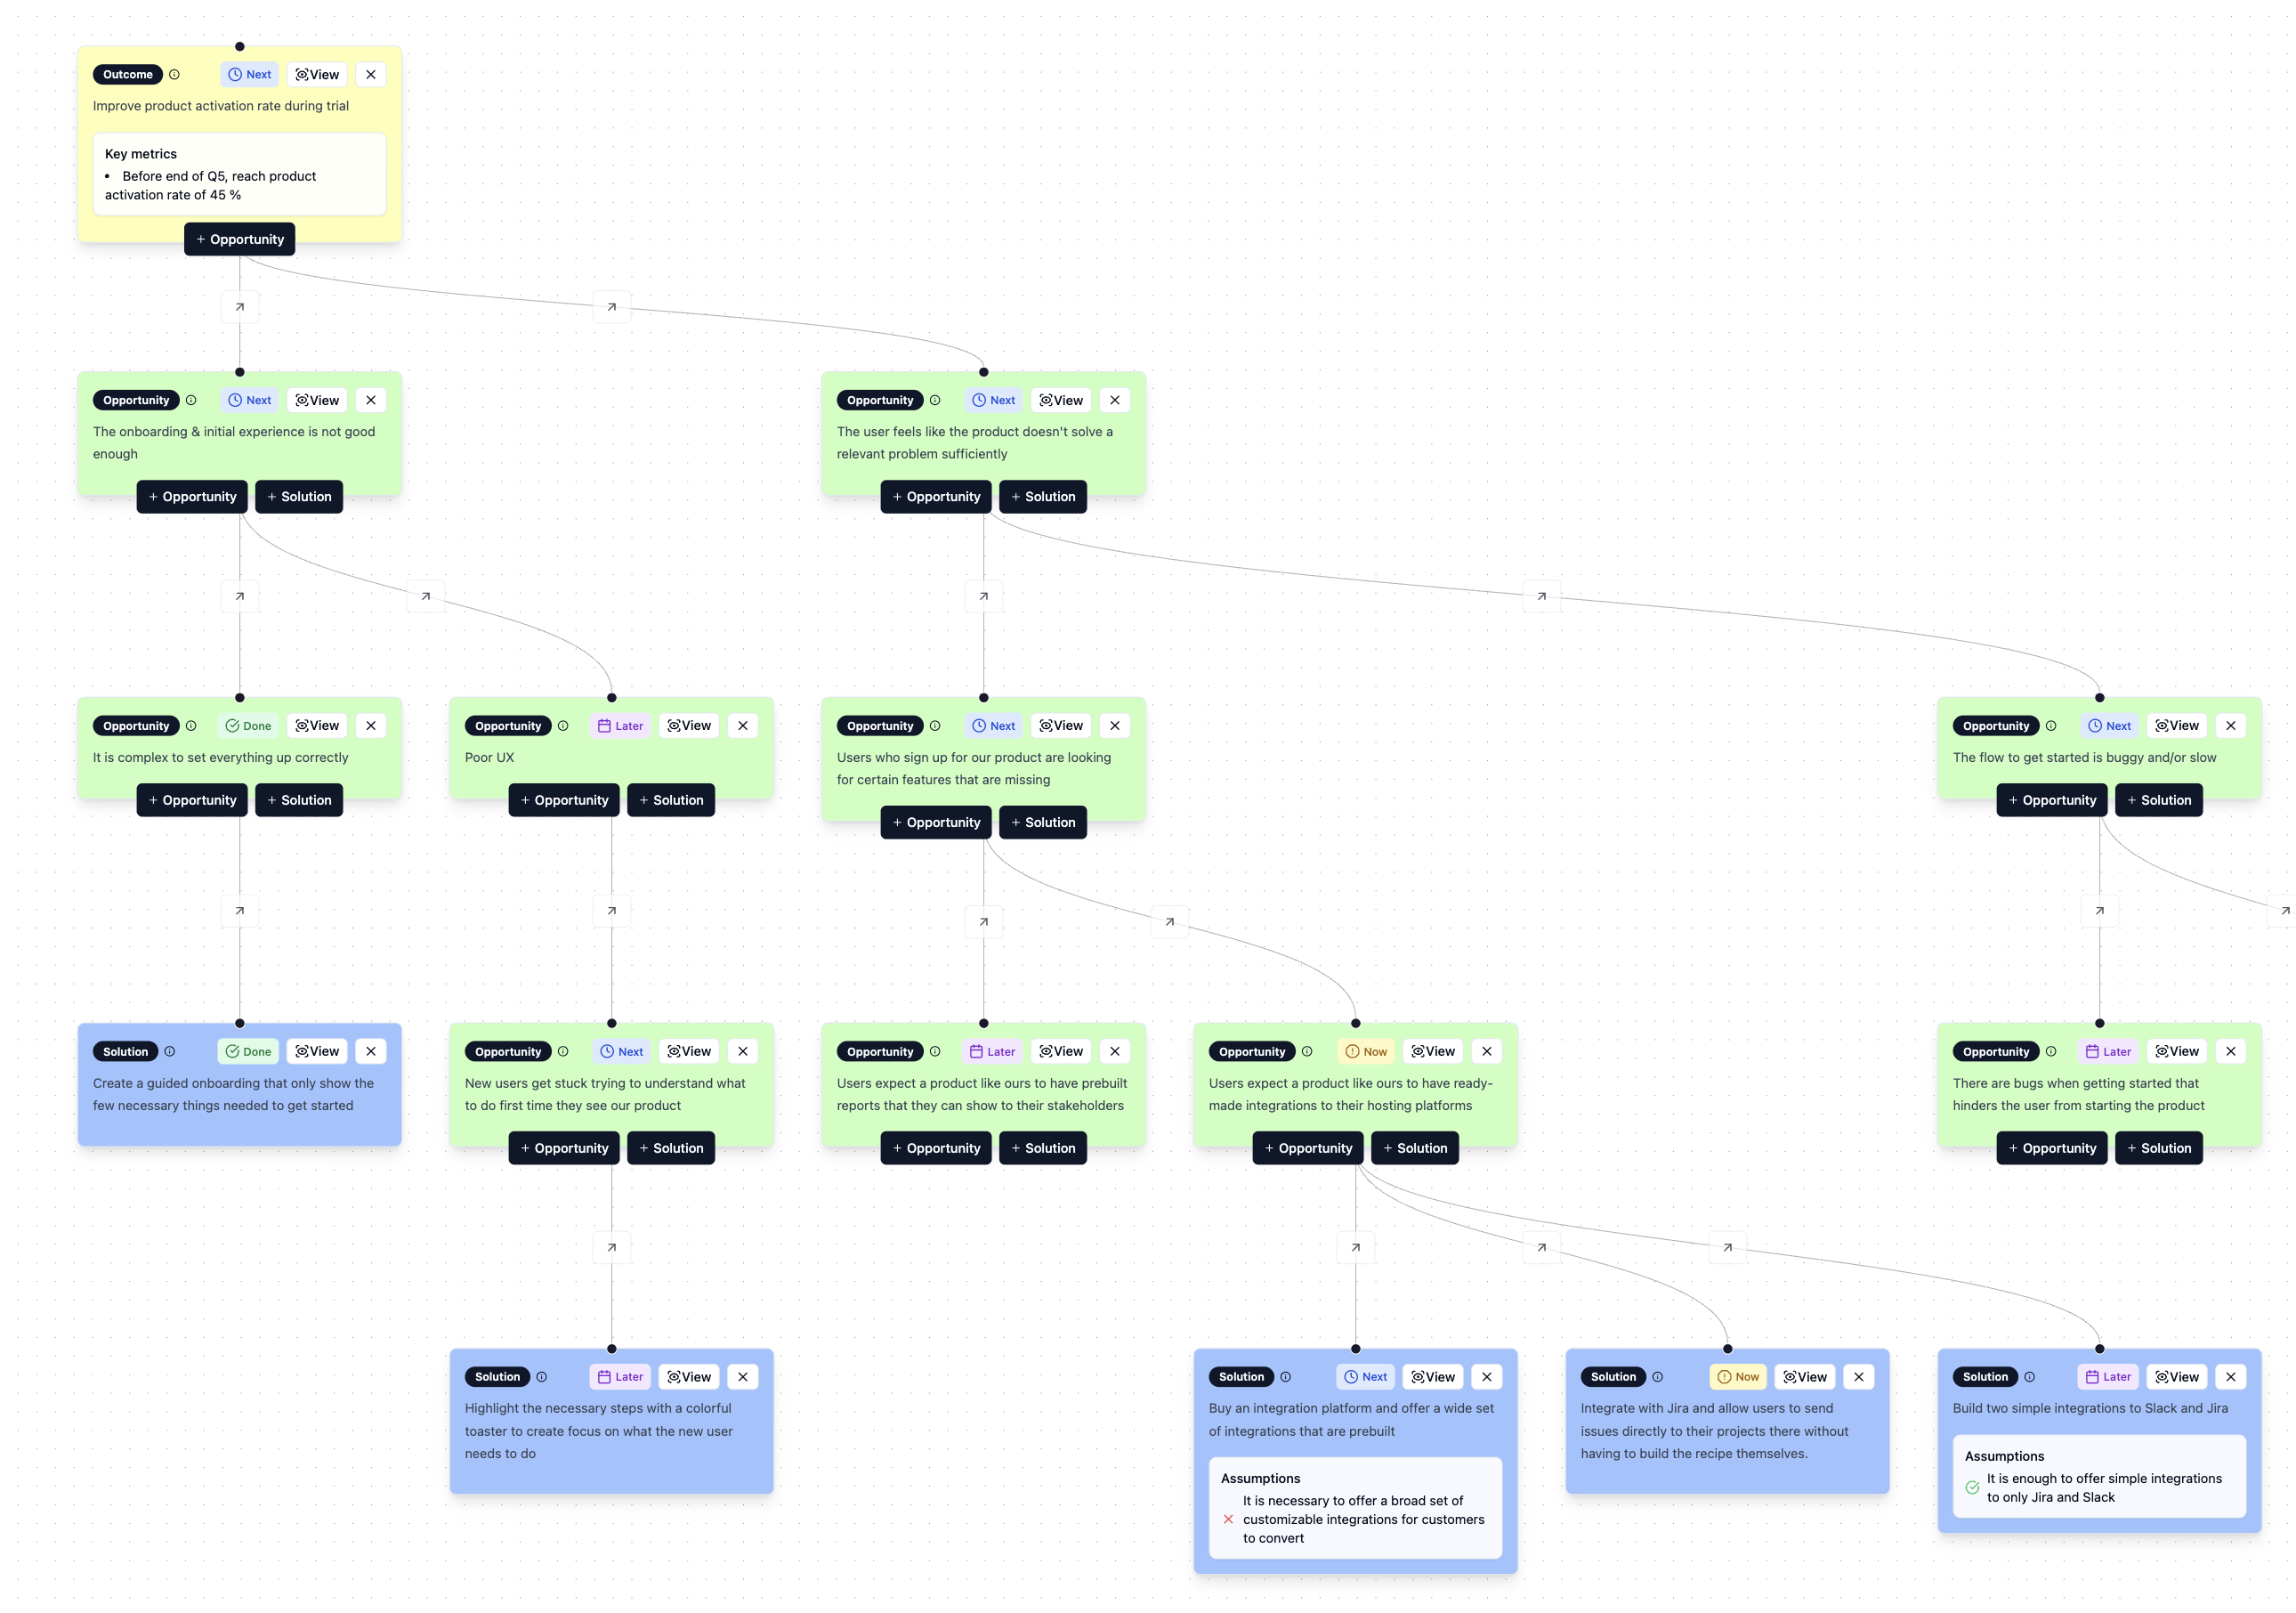
Try OppFlow’s OST Feature for Real Results
Ready to transform your product discovery process? OppFlow provides specialized tools for building, visualizing, and managing your Opportunity Solution Trees—giving product teams the clarity and alignment needed to deliver real outcomes and true customer value.
Get started with OppFlow and experience the difference a structured, outcome-driven framework can make in your product strategy.
Sources: